
Tooltips
Tooltips are provided for each bar/visual to offer information on what data is being presented (Figure 6, red circle). To read the tooltip, click the bar/visual and a box will pop up providing details about the data. The data in each tooltip will vary.
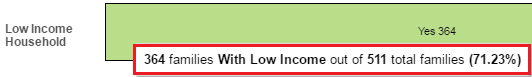
Figure 6